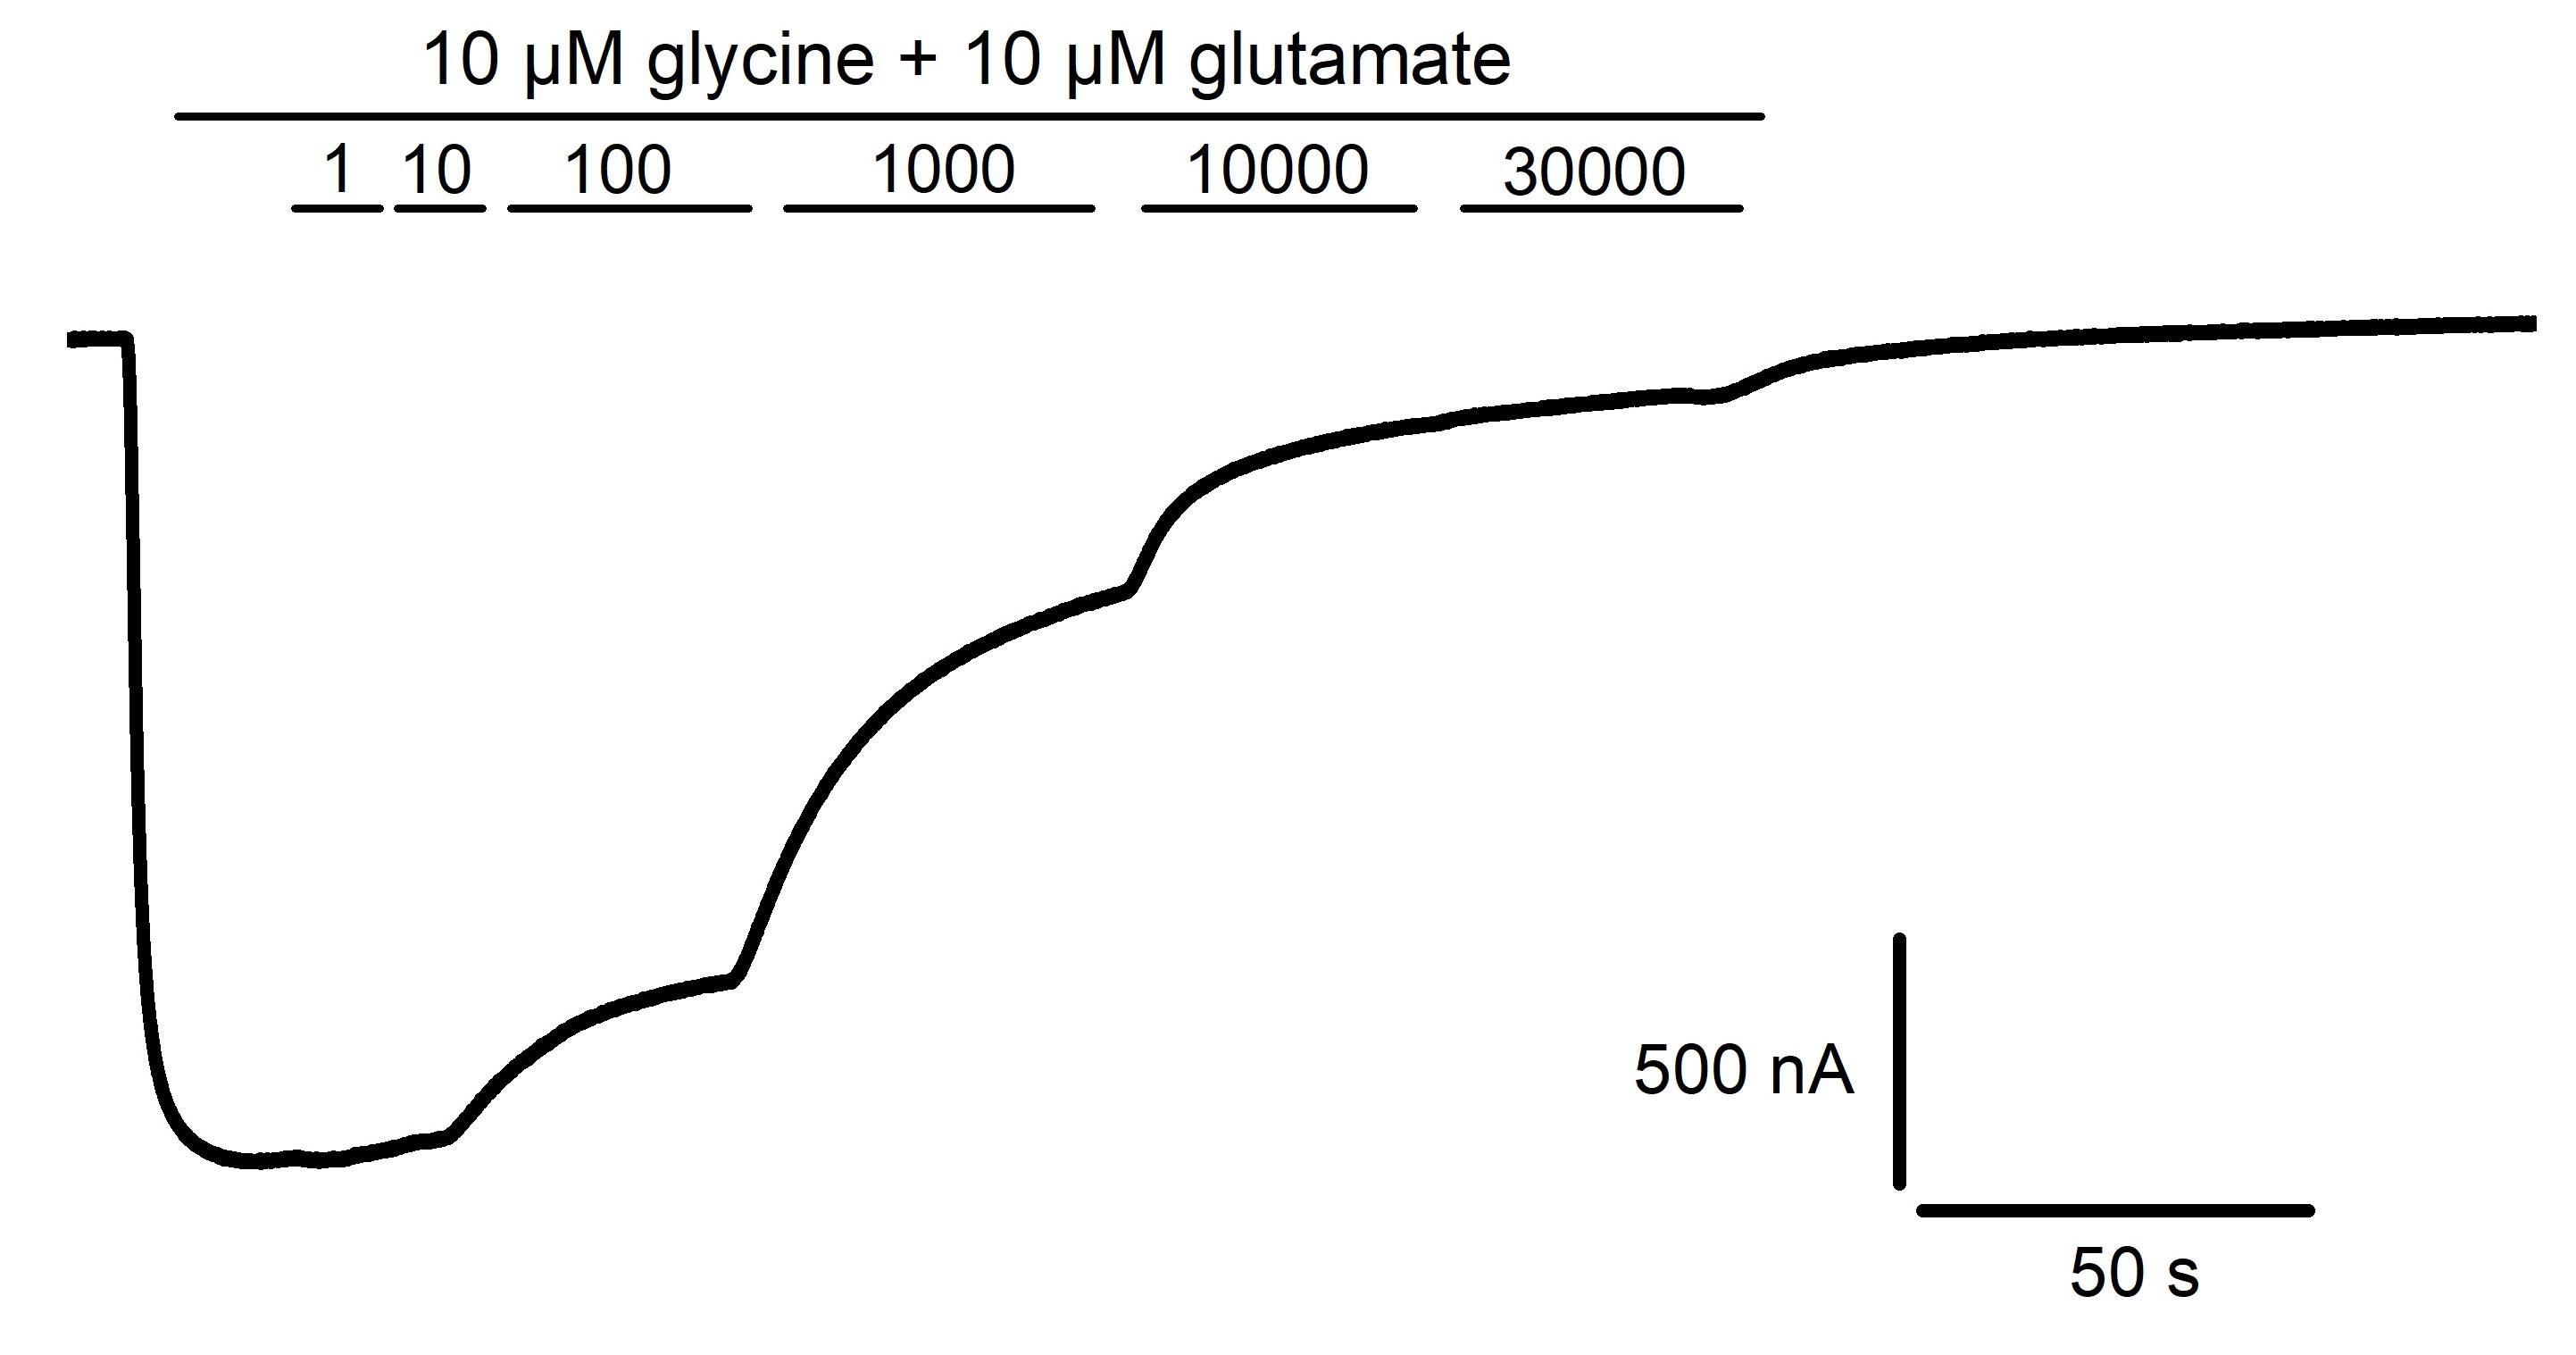
Fig. 2. Example current trace of GluN1-1a/GluN2B expressing oocytes. After activation by 10 µM glycine and 10 µM (S)-glutamate the receptor was inhibited by ascending inhibitor concentrations, ranging from 1 up to 30,000 nM. The typical curve recorded with fluoro derivative 10 is shown exemplarily.